5. Data Handling Mathematics class 8 exercise Exercise 5.3
5. Data Handling Mathematics class 8 exercise Exercise 5.3 ncert book solution in english-medium
NCERT Books Subjects for class 8th Hindi Medium
Exercise 5.1
1. For which of these would you use a histogram to show the data? (a) The number of letters for different areas in a postman’s bag.
(b) The height of competitors in an athletics meet.
(c) The number of cassettes produced by 5 companies.
(d) The number of passengers boarding trains from 7:00 a.m. to 7:00 p.m. at a station.
Give reasons for each.
Ans.
In the case of the data given in alternative (b) and (d), we will use histogram as we can divide
The given data in class intervals. In case of alternative (a) and (c), we do not know about the numbers of letter of different areas and the number of cassettes produces by given companies. We don’t have any approximate idea about it. Therefore, we cannot define class intervals for this data and thus we will note use a histogram.
2. The shoppers who come to a departmental store are marked as: man (M), woman (W), boy (B) or girl (G). The following list gives the shoppers who came during the first hour in the morning:
W W W G B W W M G G M M W
W W W G B M W B G G M W W M M W W W M W B W G M W W W G W M M W W M W G W M G W M M B G G W
Ans:
By observing the data above, we can make a frequency distribution table as follows.

3. The weekly wages (in `) of 30 workers in a factory are.
830, 835, 890, 810, 835, 836, 869, 845, 898, 890, 820, 860, 832, 833, 855, 845,
804, 808, 812, 840, 885, 835, 835, 836, 878, 840, 868, 890, 806, 840
Using tally marks make a frequency table with intervals as 800–810, 810–820 and so on.
Ans:

- 830-840 is the group which has maximum number of workers.
- The worker who earn more than Rs 850 are the number of workers who fall in the group of 800-810 or 810-820 or 820-830 or 830-840 or 840-850 Hence the total number of workers earning less than 850 will be the sum of the numbers of all these workers i.e. 3 + 2 + 1 + 9 + 5 = 20
5. The number of hours for which students of a particular class watched television during holidays is shown through the given graph.
Answer the following.
- for how many hours did the maximum number of students watch TV?
- How many students watched TV for less than 4 hours?
- How many students spend more than 5 hours in watching TV?
Answer:
- From the graph, it can be observe that the maximum number of students watched TV for 4 – 5 hours.
- The students who watched TV for less than 4 hours are students who watched TV for 1-2 hours or 2-3 hours or 3-4 hours.
Hence the total number of students = 4 + 8 + 22 = 34
- The students who watched TV for more than 5 hours are students who watched TV for 5-6 hours or 6-7 hours.
Hence, total number of students = 8 + 6 = 14

Exercise 5.2
Exercise 5.2
- A survey was made to find the type of music that a certain group of young people liked in a city. Adjoining pie chart shows the finding of this survey.
- If 20 people liked classical music, how many young people were surveyed?
- Which type of music is liked by the maximum number of people?
- If a cassette company were to make 1000 CD’s, how many of each type would they make?
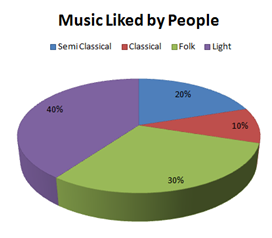
- Number of people who like classical music = 10 %
This 10% present 20 people.
So, 10% represent = = 200 people.
Therefore, 200 young people were surveyed.
- From the pie chart, it can be easily observed that the light music is represented by the maximum part of the pie chart 40%. Hence, most of the people like light music.
- Number of CD’s of classical music = 10% of 1000
= 100
So, the number of CD’s of semi classical music = 20% of 100
= = 200
So, the number of CD’s of folk music = 30%
= = 300
And the number of cassettes of light music = 40% of 1000
= = 400
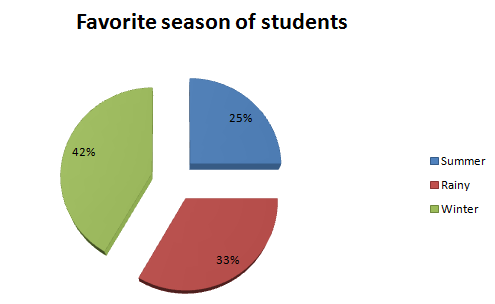
2. A group of 360 people were asked to vote for their favorite’s season from the three seasons rainy, winter and summer.
(i) Which season got the most votes?
(ii) Find the central angle of each sector.
(iii) Draw a pie chart to show this information.
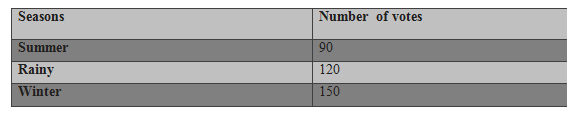
Answer:
- Winter.
- Total number of votes = 90 + 120+ 150 = 360
Question 3:
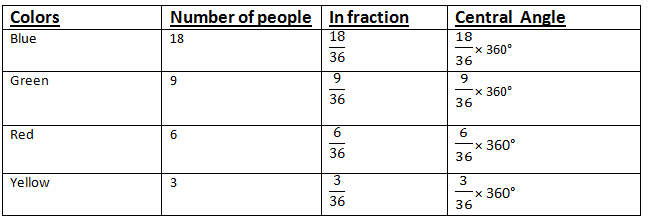
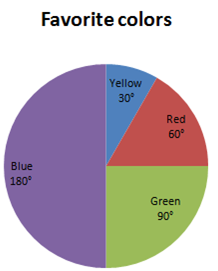
Draw a pie chart showing the following information.
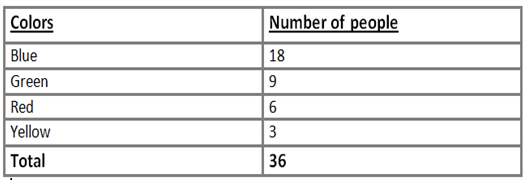
Ans:
The central angle for each color can be calculated as follows.
Question:
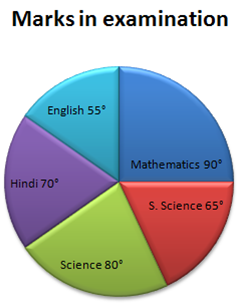
The adjoining pie chart gives the mark scored in a examination by a student in Hindi, English, Mathematics, Social science and science. If the total marks obtained by a student were 540, answer the following question.
In which subject did the students score 105 marks?
How many more marks were obtained by the students in mathematics than Hindi?
Examine whether the sum of the marks obtained in social science and mathematics is more than that in science and Hindi.
(HINT: Just study the angle.)
Answer:
The central angle of each subject can be calculated as follows
A pie chart of the above data is as follows.
Exercise 5.3
Exercise 5.3
1. List the outcomes you can see in these experiments.
Spinning a wheel
Tossing two coins together

Answer:
On spinning the given wheel, the possible outcomes are A, B, C, and D.
By tossing two coins together , the possible outcomes ate HT, TH, HH, TT, where H and T presents head and tail of coins respectively.
2. When a die is thrown
- list the possible outcomes of an event of getting
- (a) a prime number (b) not a prime number
- (a) a number greater than 5 (b) a number not greater than 5
- (a) When a dice is thrown, the possible outcomes, 2, 3, 5, are prime numbers. Hence, these are the possible outcomes of an event of not getting a prime number on the face of a dice
(b) Out of these outcomes 1, 4, 6 are not prime numbers. Hence these are the outcomes of an event of not getting a prime number on the face of a dice.
(ii) (A) out of these outcomes, a number greater than 5 is possible 6 when the number of face of
The dice.
(b) Out of these outcomes, a number is not greater than 5 is possible when the number the second
Number on the face of the dice is anyone of the outcomes 1, 2, 3, 4, 5.
Select Class for NCERT Books Solutions
NCERT Solutions
sponder's Ads
